mBot: Graphing with Sensors (Gr. 8)
Using Clever Programming to Graph the Output of the mBots Sensors

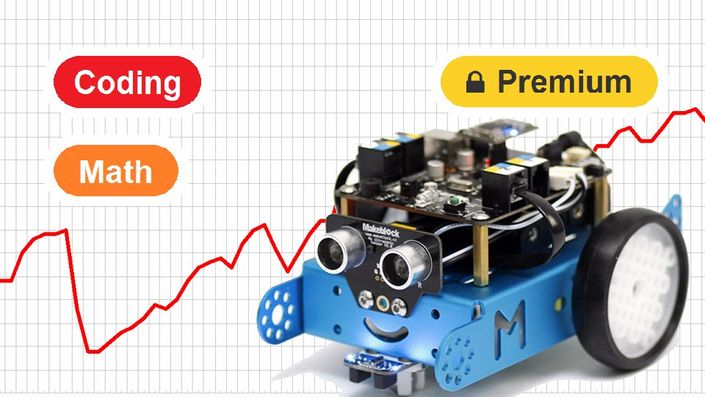
Description
The mBot and the mBlock software are both perfect tools to explore graphing. In this lesson, students will learn how to graph the data coming in from their mBot's sensors onto the screen in front of them. After that, students will take it to the next level by being critical about the way they display their data, and explore the effects of offsetting, and exaggerating their data.
Objectives
- Understand Scatter Plots (Lesson Focus)
- Understand Distance Time Graphs
- Understand Variables (coding)
- Understand Loops
- Understand If Statements
Curriculum Connections Summary
- Ontario - Mathematics - Algebra (Coding)
- Quebec - Mathematics
- New Brunswick - Mathematics
- Nova Scotia - ICT
- Alberta - Mathematics & ICT/CTF
- British Columbia - Mathematics & ADST
- Manitoba - Mathematics
- Prince Edward Island - Mathematics
- Saskatchewan - Mathematics
- Newfoundland & Labrador - Mathematics
- Yukon Territories - Follow's B.C.'s Curriculum
- Northwest Territories - Follows Alberta's Curriculum
- Nunavut - Follows Alberta's Curriculum
Robots and Accessories
- mBots
Other Supplies
- Laptops
- Makeblock Software
Find Out More

mbot is the best of both worlds, transitioning students from Scratch Blocks to Text Code