CyberPi: Normal Distributions (Gr. 9-10)

Python Coding: Beginner
Description
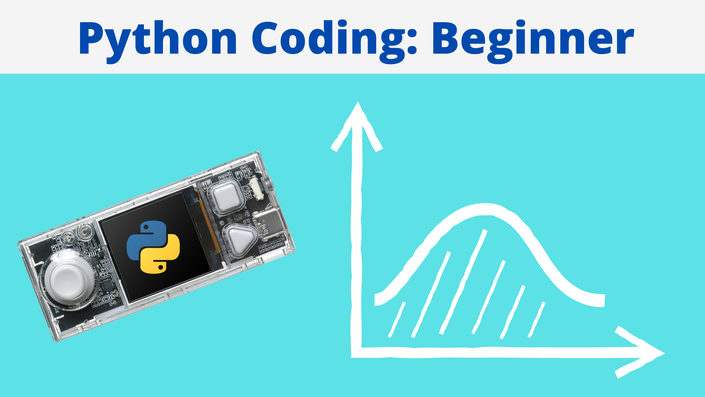
In this lesson, students will explore the concept and features of normal distributions through Python. By taking the dice roll probabilities as an example, students will create data charts to represent all the possible outcomes and visualize the distribution of all the results of the sum of the two dice. Students will also measure and investigate the spread of the data to gain an understanding of the normal distribution concept.
Objectives
- Using lists in Python to store groups of values of the same data type
- Modifying and extracting data from lists
- Using the graphs (bar charts) capabilities of CyberPi to output data
Curriculum Connections Summary
- Ontario - Mathematics - Algebra (Coding) & Computer Science
- Quebec - Coming Soon!
- New Brunswick - Coming Soon!
- Nova Scotia - Coming Soon!
- Alberta - Coming Soon!
- British Columbia - Coming Soon!
- Manitoba - Coming Soon!
- Prince Edward Island - Coming Soon!
- Saskatchewan - Coming Soon!
- Newfoundland & Labrador - Coming Soon!
- Yukon Territories - Follow's B.C.'s Curriculum
- Northwest Territories - Follows Alberta's Curriculum
- Nunavut - Follows Alberta's Curriculum
Find Out More

Networkable microcontroller for Computer Science and AI education
CyberPi is a single-board computer, packed with advanced electronics which makes it a powerful coding machine! In combination with an impressive mBlock coding editor, it supports the development of coding skills from block-based programming to Python. The Python editor is a platform designed for learning and teaching Python and Micropython - taking AI, IoT and Data Science learning to the next level!
- Buy the CyberPi
- Makeblock software
- View All Lessons [Coming Soon]
- Subscribe for Premium Cross-Curricular Lessons [Coming Soon]
